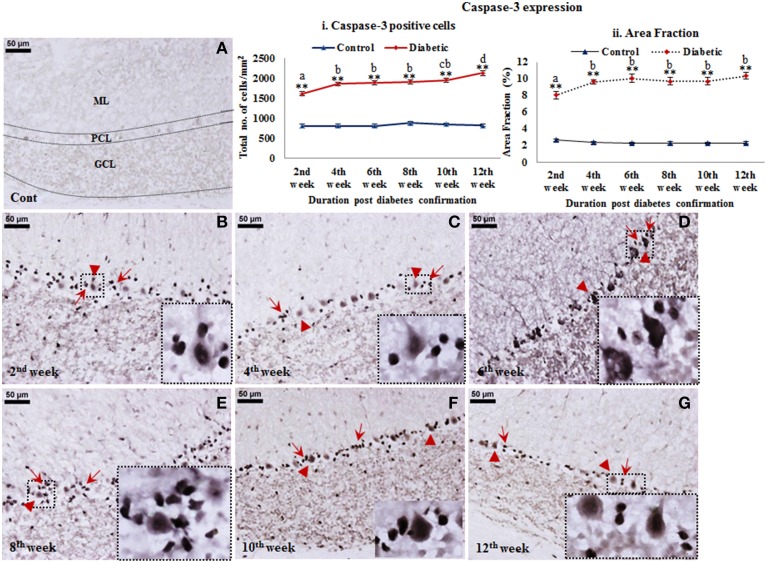
Figure 6.
Cell death detection in diabetic cerebellum. Active caspase-3 Immunolabeling revealed the conspicuous cell death following diabetes in cerebellum. Apoptotic cells were clearly visible in all the three layers of the diabetic cerebellum at all the time points (B–G). While in controls the labeling was negligible (A). The effect of diabetes was clearly demarcated in the Purkinje cell layer as Bergmann glial cells (B–G; red arrows) surrounding Purkinje cells (B–G; red arrowheads) were also showing intense immunolabeling of active caspase-3 in comparison to the molecular and granule cell layer of cerebellum. Insets were showing the enlarged images of apoptotic Purkinje cell with surrounded Bergmann glial cells. Scale bar = 50 μm. Cell quantitation (i) and area fraction (ii) graphs were presenting the increased stature of active caspase-3 immunolabeled apoptotic cells in various layers of the cerebellum following diabetes. Quantitative assessment data were showing significant increment in apoptotic cell population and volumetric fraction at all the diabetic time points in comparison to controls. Same alphabets on bars indicate non-significant differences between groups at the given time points (p ≤ 0.001). Value represents mean ± s.e.m. of the 30 readings/animal/time point. **p ≤ 0.001 for comparison of diabetic group with the respective controls.

