
Figure 4.
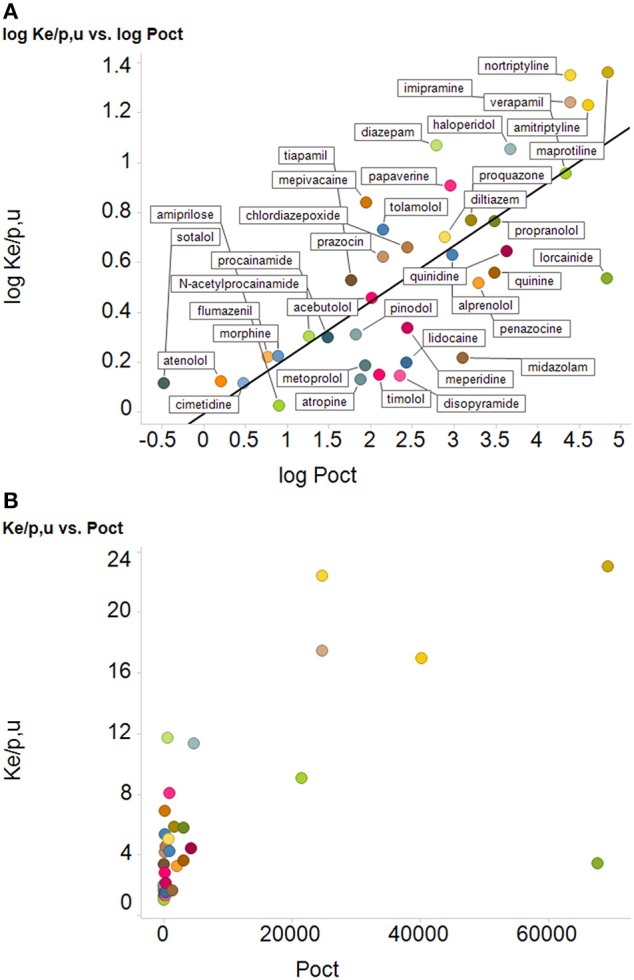
Relationships between uptake of drugs into erythrocyte and their log P, (A) as redrawn from the plot in Figure 4 of Smith et al. (2014), along with their best-fit straight line (logKe/p,u = −0.013 + 0.22 logPoct), r2 = 0.59, and (B) the same data plotted with the ordinate encoded linearly, using the same colored symbols as in Figure 4A. We do not try to fit a straight line through the left-hand 32 drugs and the right-hand 6 drugs.