
Figure 8.
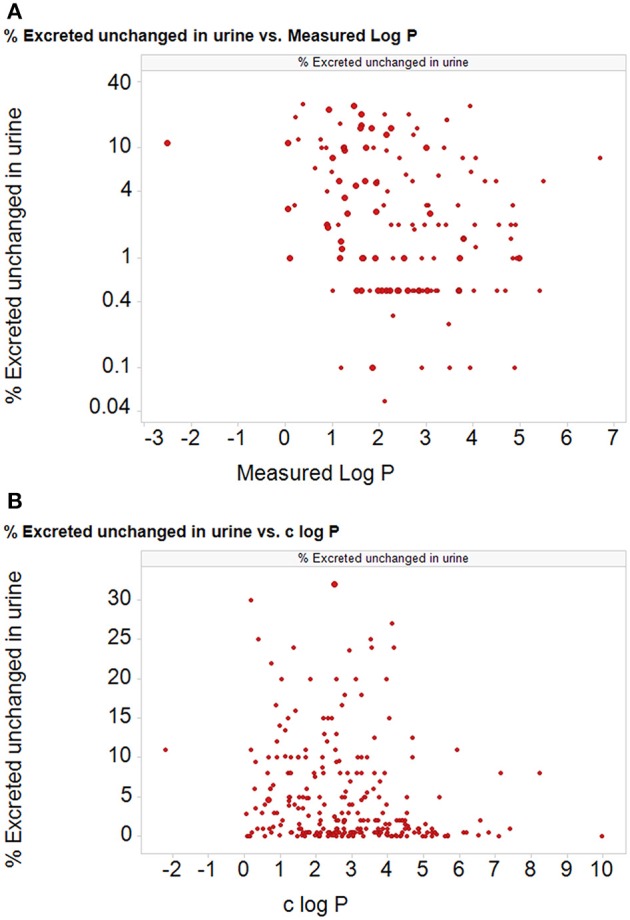
The percentage of particular drug doses excreted in the urine for 350 of 351 “class 1” BDDCS drugs (Benet et al., 2011; one drug was excluded as it was too water soluble to measure) as a function of (A) the measured and (B) the calculated log P (c log P) (calculated using the RDKit software Landrum et al., 2011 and KNIME, Berthold et al., 2007; Mazanetz et al., 2012). Ordinate data are taken from Table 1 of Benet et al. (2011).