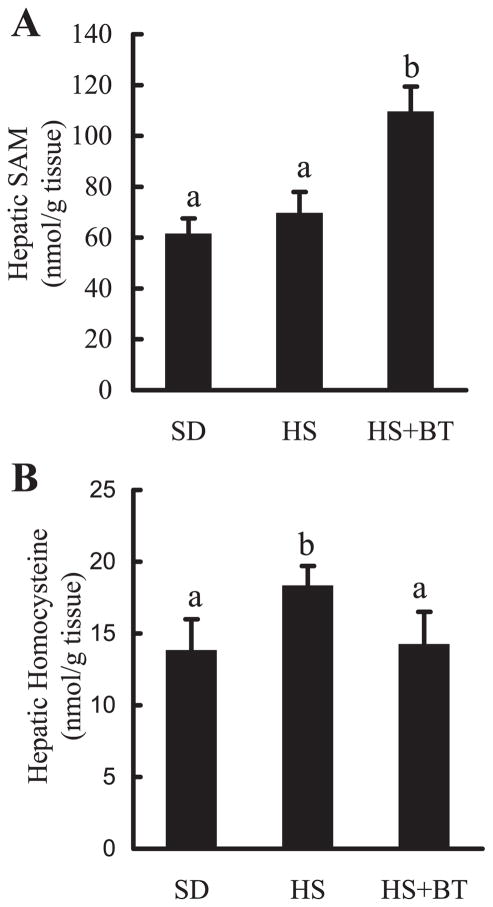
Fig. 3.
Changes of hepatic methionine metabolism. Male C57BL/6 mice were fed with high-sucrose diet in the presence or absence of betaine supplementation (1%) in the drinking water for 16 wk. Liver samples were homogenized with 4% metaphosphoric acid and hepatic S-adenosylmethionine (SAM) and homocysteine contents were assayed by high-performance liquid chromatography. A: changes of hepatic SAM levels. Data are means ± SD (n = 8). Bars with different letters differ significantly (P < 0.05). B: hepatic homocysteine levels. Data are means ± SD (n = 8). Bars with different letters differ significantly (P < 0.05).

