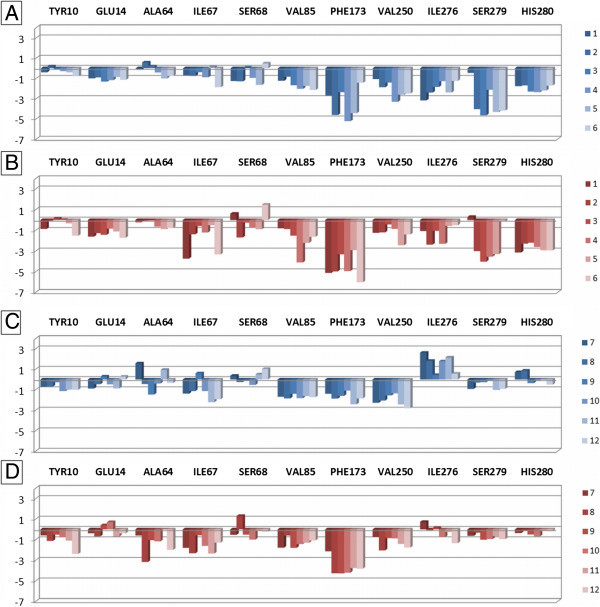
Figure 6.

Plot of interaction energies for residues belonging to the section 1 of the A 2B AR binding site, calculated with the MOE IF-E 6.0 tool. Data are represented as kcal mol-1. The blue and red versions of the plots represent the results obtained at the 2YDO- and 3QAK-A2BAR models, respectively. Plots A and B are referred to the interaction energies of nucleoside derivatives 1–6, while plots C and D are referred to the non-nucleoside derivatives 7–12.
