Figure 10.

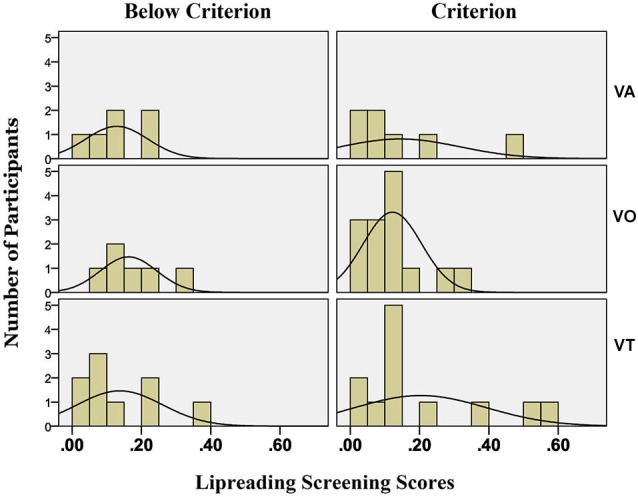
Histogram of numbers of participants sorted on whether they achieved criterion during training (left column) or not (right column). Row 1, VA; Row 2, VO; Row 3, VT. Normal curves are fitted to each distribution.

Histogram of numbers of participants sorted on whether they achieved criterion during training (left column) or not (right column). Row 1, VA; Row 2, VO; Row 3, VT. Normal curves are fitted to each distribution.