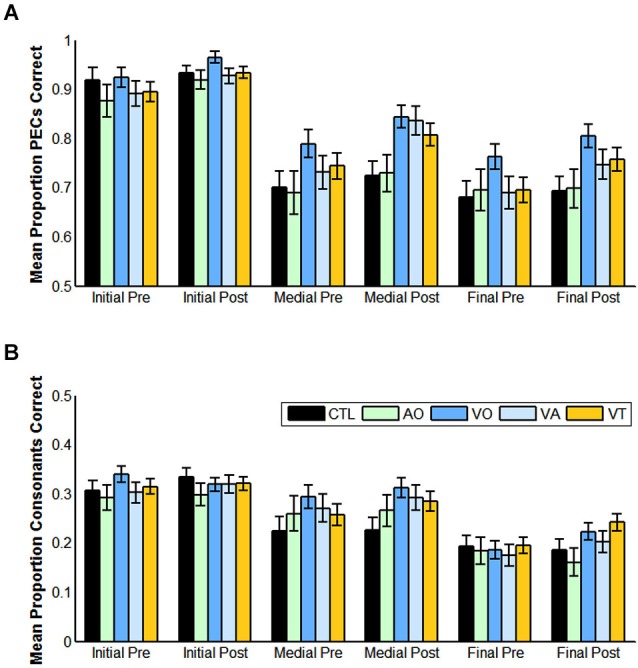
Figure 4.

Pre- and post-training consonant identification scores for each condition of training and for controls, and for each position (initial, medial, final) in the CVCVC stimuli. These figures show the results averaged across all participants within each group. (A) Mean proportion phoneme equivalence classes (PECs) correct. (B) Mean proportion consonants correct. Note: Scales are different in (A) and (B) reflecting the more liberal scoring in (A). Error bars are standard error of the mean.
