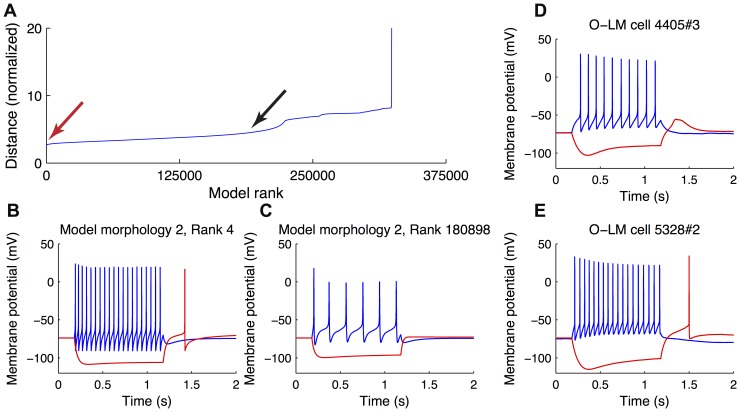
Figure 2. Ranking of O-LM models against experimental data.
(A) The ranking of models against O-LM cell experimental recordings shows a gradual decrease of the goodness-of-fit of a given model as the rank of the model becomes poorer. Hyperpolarizing and depolarizing voltage responses of two representative models, a highly-ranked one (B, red arrow in A) and poorly-ranked one (C, black arrow in A) are shown for comparison purposes. Examples of experimental voltage traces are shown in (D, E).

