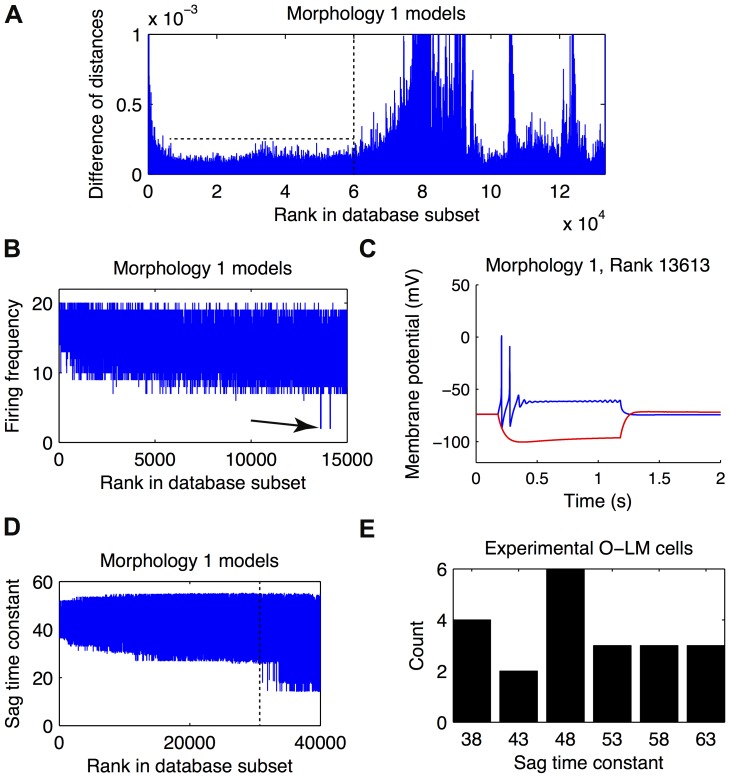
Figure 3. Extracting subsets of appropriate O-LM models from the database.
(A) Plot showing the general subset cutoff determined by visual examination of the derivative of the distance metric with respect to the model ranking in the database. Vertical dashed line shows cutoff point. (B) The firing frequency plotted as a function of model rank demonstrates one restricted subset of O-LM models. The arrow points to the first failure-to-fire model, thus marking the cutoff point for this restricted subset. (C) The voltage traces of the failure-to-fire model shown in (B). (D) The time constant of the hyperpolarization-induced sag plotted as a function of model rank. The vertical dashed line shows the point in the ranking at which the time constant starts to deviate from the experimentally observed time constants. (E) Histogram of hyperpolarization-induced sag time constants within the experimental O-LM cell dataset.

