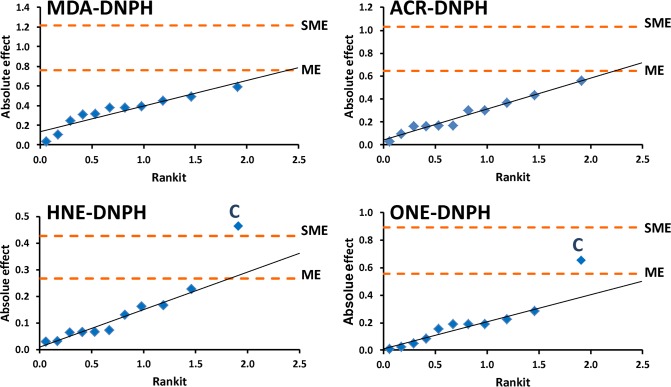
Figure 3.
Half-normal probability plots of the absolute effects on the retention time difference measured between light and d3-labeled aldehyde hydrazones in the Plackett–Burman experimental design with identification of margin of error (ME) and simultaneous margin of error (SME) as critical effects. C factor denotes gradient time.

