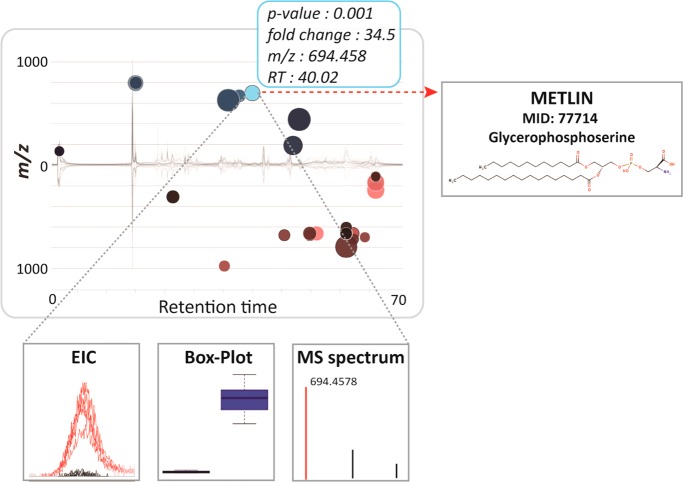
Figure 4.
Interactive cloud plot with customized metabolomic data visualization. When a user scrolls the mouse over a bubble, feature assignments are displayed in a pop-up window (m/z, RT, p-value, fold change) with potential METLIN hits. Each bubble is linked to the METLIN database to provide putative identifications based on accurate m/z. When a bubble is selected by a mouse click, its EIC, box–whisker plot, and MS spectrum appear on the bottom of the main panel. The feature with m/z 694.458 and a putative METLIN hit for glycerophosphoserine (PS) seems to be specific to the SUP-T1 parental cell line.

