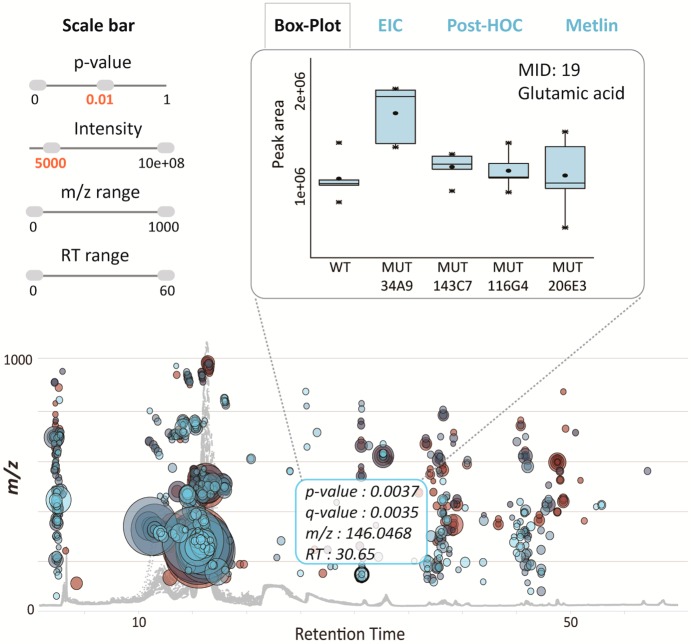
Figure 6.
Interactive multigroup cloud plot with customized metabolomic data visualization. Metabolite features whose level varies significantly (p < 0.01) across wild-type and different mutants are projected on the cloud plot depending on their retention time (x-axis) and m/z (y-axis). Each metabolite feature is represented by a bubble. Statistical significance (p-value) is represented by the bubble’s color intensity. The size of the bubble denotes feature intensity. When the user scrolls the mouse over a bubble, feature assignments are displayed in a pop-up window (m/z, RT, p-value, fold change). When a bubble is selected by a “mouse click”, the EIC, Box-Whisker plot, Posthoc, and METLIN hits appear on the main panel. Each bubble is linked to the METLIN database to provide putative identifications based on accurate m/z. The variation pattern of glutamic acid (m/z 146.0468, MS/MS METLIN match) across different mutants is shown by a box–whisker plot.

