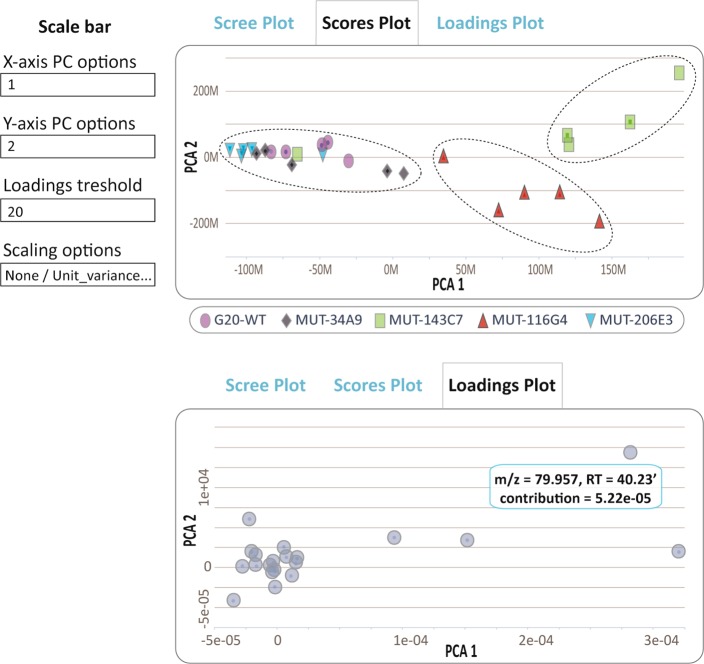
Figure 7.
Interactive principal component analysis. A Scores plot showing the correlation between the samples (top panel) and a Loadings plot showing the relationship between the metabolite features that relate to the sample grouping (bottom panel). The clusters represent wild type and different mutant strains of Desulfovibrio alaskensis G20 (WT: wild type; MUT: mutant). The annotations for different mutant strains are given in the legend of Figure 5. The user has the option to set the loadings threshold and to apply different scaling criteria.

