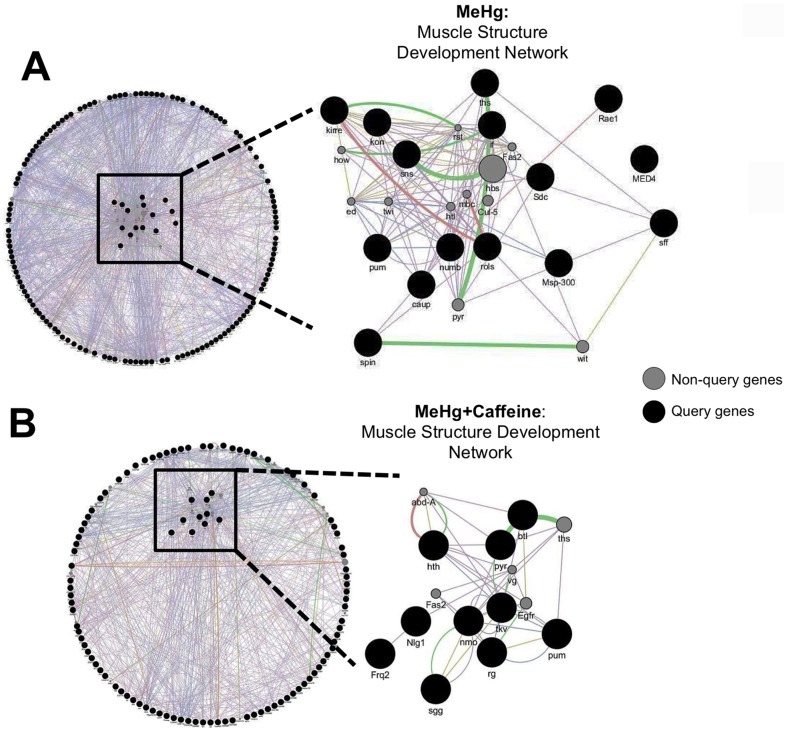
Figure 5. A shared functional network among non-overlapping genes identified in GWA of MeHg alone and MeHg+caffeine treatments.
Network maps generated by GeneMANIA illustrate an example of a shared network for muscle structure development of genes identified in the GWA for MeHg alone (A) and MeHg+caffeine (B). Interactions are identified at the level of co-expression (purple lines), co-localization (blue lines), genetic interactions (green lines) and physical interactions (red lines). Query genes from the GWA analyses are represented by black circles and non-query genes (computationally recruited to complete network associations) are indicated by gray circles. The cluster of genes comprising the network is sorted to the inside of the circle, while the remaining query genes, not associated with the network, remain on the periphery.

