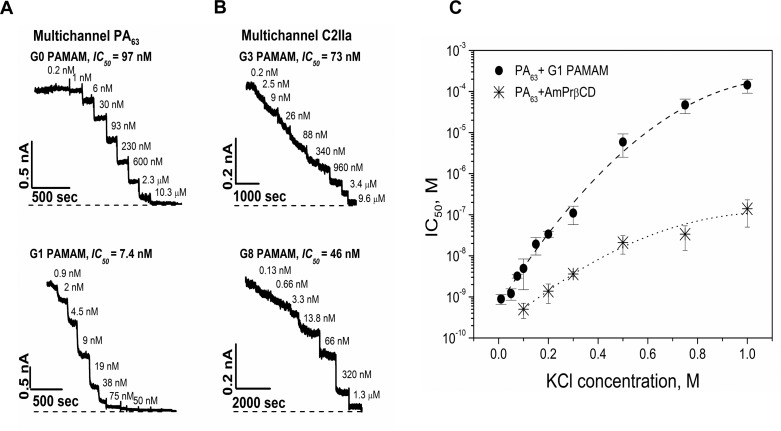
Figure 1.
PAMAM Dendrimer-Induced PA63 and C2IIa Pore Inhibition at Multichannel Level. (A) Multichannel PA63 conductance changed by G0 (top) and G1 (bottom) dendrimer addition to the cis-compartment of bilayer chamber. (B) Multichannel C2IIa conductance changed by G3 (top) and G8 (bottom) dendrimer addition to the cis-compartment of bilayer chamber. The current recordings were additionally filtered over a 100 ms time interval. A 0.1 M KCl solutions at pH 6 were buffered by 5 mM MES. Recordings were taken at 20 mV applied voltage. The dashed lines represent zero current levels. The lowest and greatest dendrimer concentrations that are not marked in the figures are given in Figure S4 (titration curves). (C) IC50 values of the PA63/G1-NH2 binding reaction increase with KCl bulk concentration (filled circles). The salt dependence effect is stronger than the one reported earlier for the AmPrβCD blocker (stars).14 The AmPrβCD data are reprinted with permission from ref (14). Copyright 2010 Elsevier.

