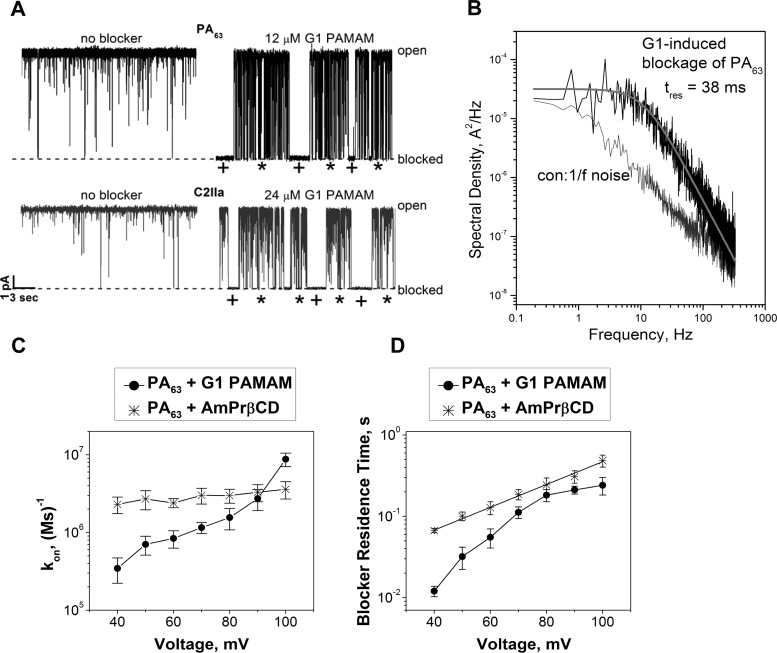
Figure 3.
Single channel analysis of the PA63/G1-NH2 binding reaction. (A) Conductance of single PA63 (top) and C2IIa (bottom) channels in the absence (left) and presence (right) of PAMAM dendrimers G1 in the cis-side of the bilayer chamber shows the bimodal character of the dendrimer-induced action. Recordings are shown at 50 ms time resolution. 1 M KCl solutions at pH 6 were buffered by 5 mM MES. Recordings were taken at 50 mV applied voltage. Higher concentrations of G1 compared to the ones reported in Table 1 were needed because of the increased supporting electrolyte concentrations (1 M vs 0.1 M) used for the single-channel measurements. “*” and “+” indicate two different modes of the dendrimer binding. (B) Power spectral densities of PAMAM dendrimer G1 induced PA63 current fluctuations. PA63 single channel current fluctuations in presence of G1 (black spectrum) can be fitted by the single Lorentzian in contrast to 1/f noise in the blocker-free (con) solutions (shaded spectrum). (C, D) Kinetic parameters of PAMAM dendrimers G1 binding as functions of transmembrane voltage compared with the data earlier reported for AmPrβCD.14 (C) The on-rate constant, kon, of G1 binding to PA63 shows strong voltage dependence (filled circles) in contrast to the AmPrβCD blocker (stars). (D) The G1 binding time (filled circles) shows strong nonexponential voltage dependence in contrast to the AmPrβCD binding time (stars), which is nearly exponential (linear when plotted in a semi logarithmic scale). The AmPrβCD data are reprinted with permission from ref (14). Copyright 2010 Elsevier.

