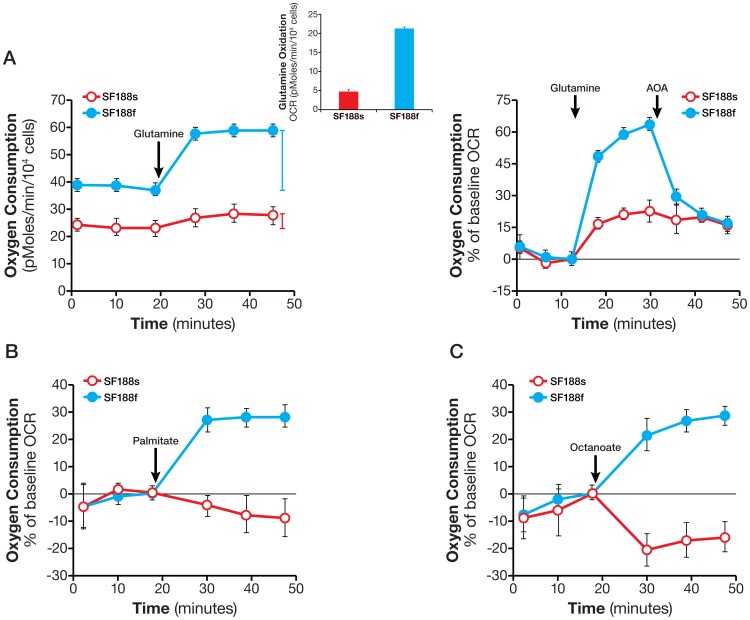
Figure 8. Enhanced glutamine oxidation and activation of fatty acid oxidation in SF188f cells.
A. Kinetic OCR response of SF188s and SF188f cells to glutamine (4 mM) (left panel). Insert: calculated glutamine oxidation rate of SF188s and SF188f cells. OCR response (% of baseline) to glutamine and AOA (100 µM) (right panel). SF188s and SF188f cells were plated at 30,000 and 20,000 cells/well, respectively, in XF24 V7 cell culture plates 24–28 hours prior to the assays. The assay medium was the substrate-free base medium. Upon completion of an assay, cells were treated with trypsin and counted for the purpose of normalization. The OCR values were normalized to pmoles/min/104 cells. A representative experiment out of three is shown here. Each data point represents mean ± SD, n = 4. B and C. OCR response of SF188s and SF188f cells to palmitate-BSA (150 mM) (B) and octanoate (1 mM) (C). SF188s and SF188f cells were plated at 20,000 and 15,000 cells/well, respectively, in XF96 V3 cell culture plates 24–28 hours prior to the assays. The assay medium was the substrate-free base medium supplemented with 5.5 mM glucose and 50 µM carnitine. Fatty acid oxidation was expressed as % OCR plotted using measurement 3 as the baseline. A representative experiment out of three is shown here. Each data point represents mean ± SD, n = 6.

