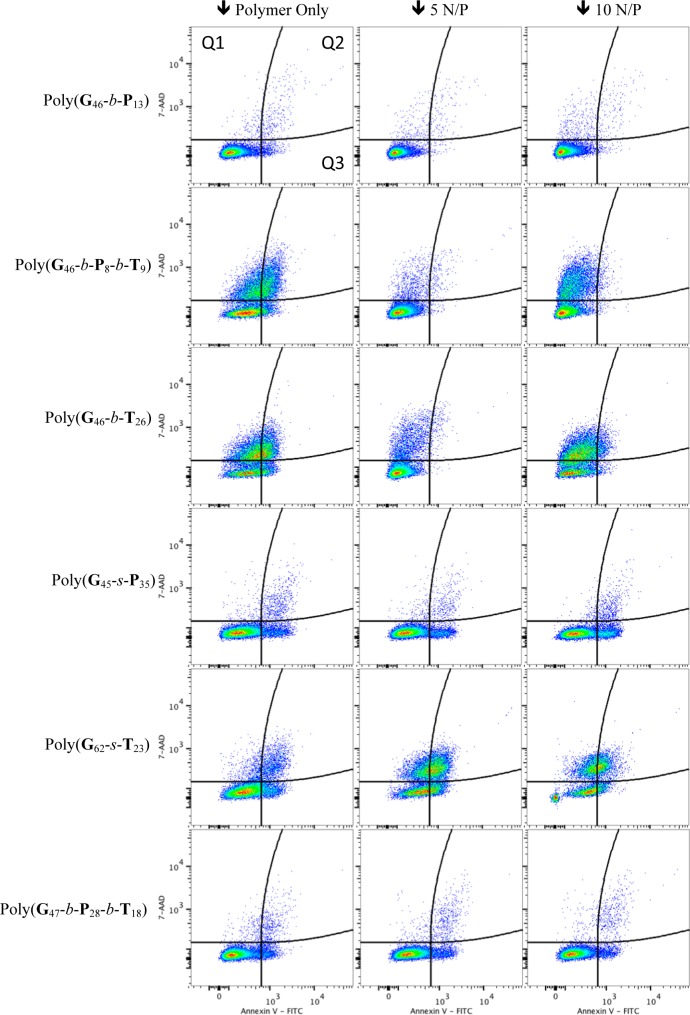
Figure 5.
Flow cytometry analysis of cells for membrane permeability (7-AAD positive), apoptosis (Annexin V positive), and necrosis (both 7-AAD and Annexin V positive). Data are plotted as 7-AAD (y-axis) versus Annexin V (x-axis). Pseudocolor represents the density of 20,000 events plotted. Quadrant 1 (Q1) depicts cells that are only 7-AAD positive (seen as red bars in Figure 6), Q2 denotes cells that are 7-AAD and Annexin V positive (double positive gray bars in Figure 6), and Q3 denotes apoptotic cells that are only Annexin V positive (blue bars in Figure 6).

