
Figure 3.
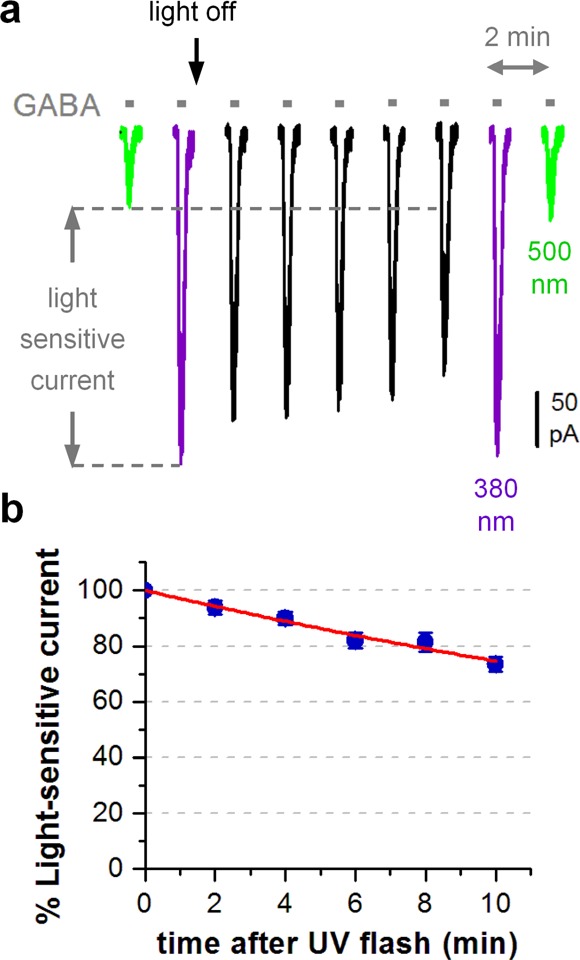
Thermal relaxation of the tethered MAB-0. (a) A representative cell (with MAB-0 conjugated α1(T125C)β2γ2S) showing the slow current reduction in darkness after an initial response measured in 380 nm. [GABA] = 10 μM. (b) Group data (mean ± SEM, n = 5) showing the time course of thermal relaxation, plotted as changes in the normalized light-sensitive current component (defined in panel a) and fitted with a single-exponential decay (red curve). Recordings were carried out in HEK293T cells held at −70 mV.