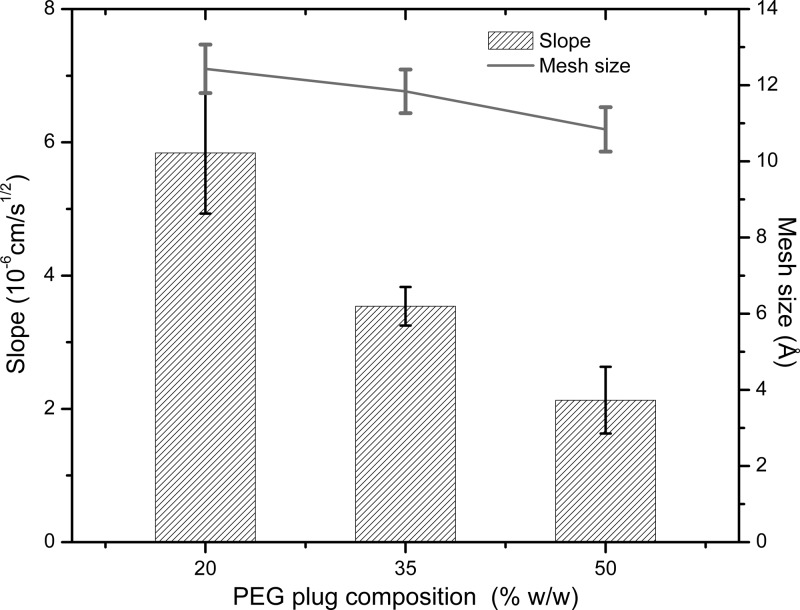
Figure 4.
Slope of the linear curve fit to the nucleation front position vs the square root of time, for each PEG plug composition (gel pore size is indicated in the right axes). This slope is a measure of the nucleation front rate in 3L counterdiffusion experiments. Error bars for the slope represent a 95% confidence interval. Error bars for the mesh size represent one standard deviation from the average value.

