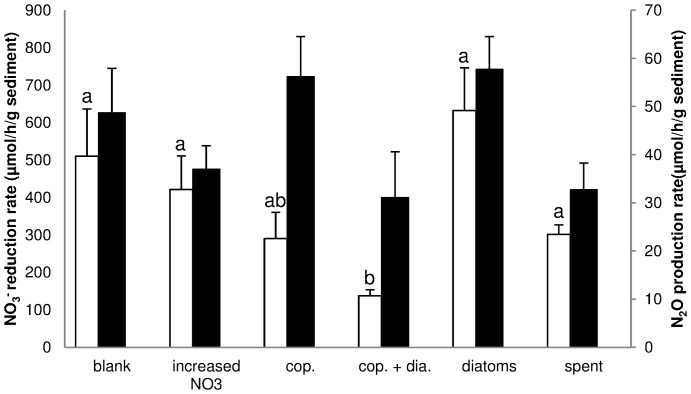
Figure 1. NO3 - reduction and N2O production rates.
NO3 - reduction rate (black bars; left y-axis) and N2O production rates (white bars; right y-axis) during the measurement of the denitrification potential for the different treatments (mean ± SE; cop. = copepods; cop. + dia. = copepod+ diatom). The different letters above the bar indicate significant differences (P<0.05; DTK) between the treatments. Light conditions (not shown) did not affect the outcome of treatments.

