Figure 1.

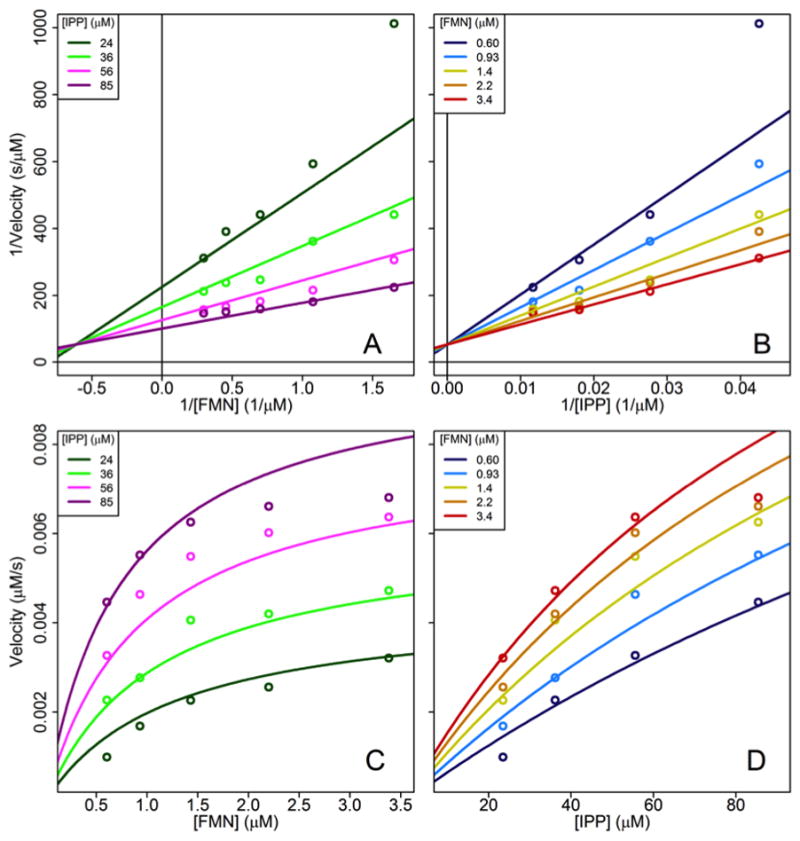
Bisubstrate kinetic plots for sp-IDI-2. Reciprocal plots (A and B) and standard plots (C and D) data points are the average from three experiments along with globally fit regression lines.

Bisubstrate kinetic plots for sp-IDI-2. Reciprocal plots (A and B) and standard plots (C and D) data points are the average from three experiments along with globally fit regression lines.