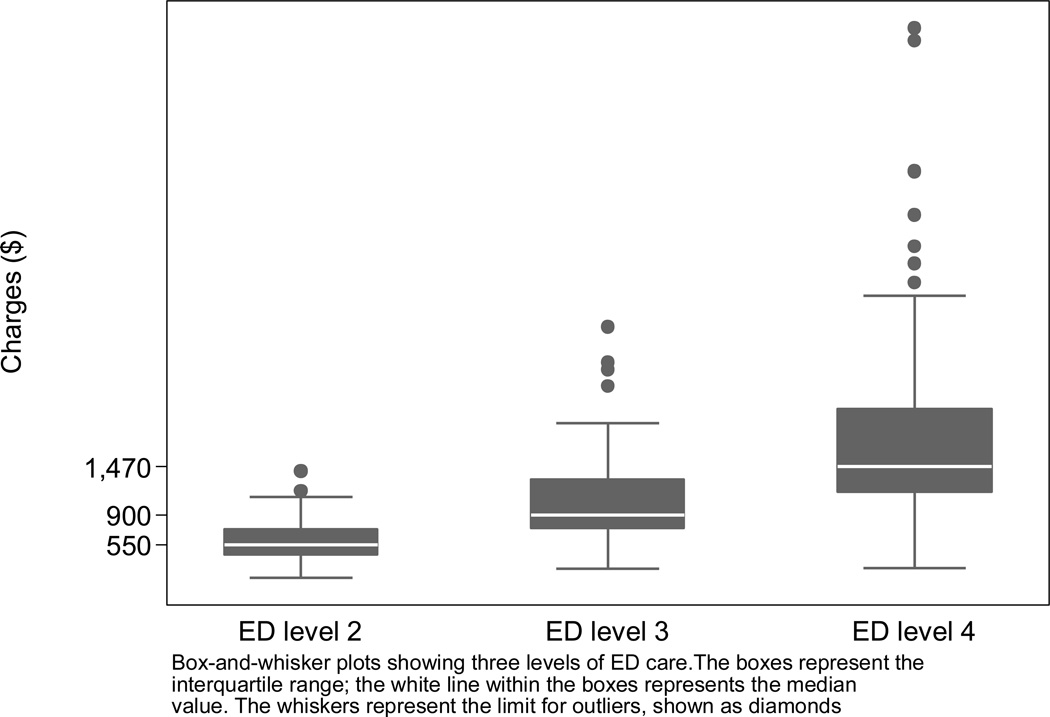
Figure 1.
Variation in hospital charges for level 2, 3, and 4 ED visits -- California, 2011.
Caption: Box-and-whisker plots showing three levels of ED care. The boxes represent the interquartile range; the white line within the boxes represents the median value. The whiskers represent the limit for outliers, shown as diamonds

