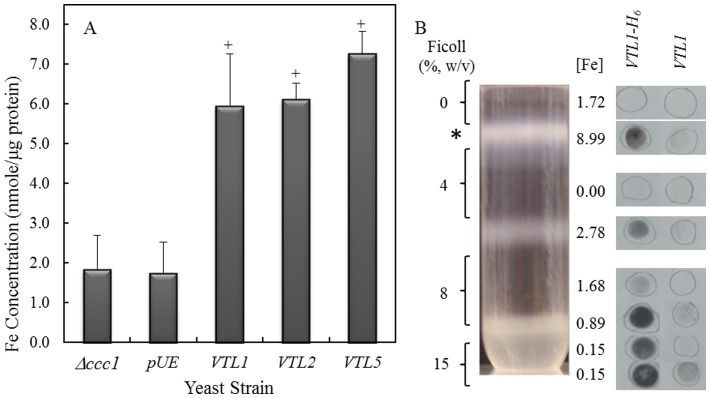
Figure 2. Determination of the Fe concentration in Δccc1 cells transformed with AtVTL1, AtVTL2 or AtVTL5.
(A) Shown is the Fe concentration in yeast vacuoles isolated from the Δccc1 mutant, Δccc1 transformed with an empty plasmid (pUE), AtVTL1, AtVTL2 or AtVTL5. Error bars indicate the standard error of the mean. Bar graphs labeled with “+” are significantly different for the Δccc1 mutant (p<0.05). (B) Vacuoles were isolated from Δccc1 yeast cells transformed with His-tagged AtVTL1 (VTL1-H6) or with untagged AtVTL1 (VTL1) as a control. AtVTL1-H6 was localized by dot-blots using an anti-His antibody. The positions of the dot-blots are approximate. The Fe concentrations (nmole/µg protein) in the fraction corresponding to the dot-blot are given.

