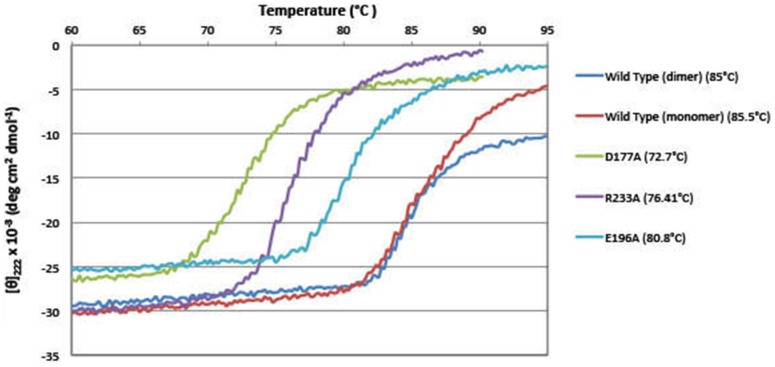
Figure 6. Temperature-dependent unfolding of tDGC and of tDGC single mutants recorded by CD spectropolarimetry.
The mean residue molar ellipticity vs temperature for proteins tDGC (dimeric form), tDGC (monomeric form, following treatment with RocR), D177A, E196A and R233A is plotted. A significant difference in the melting profiles of the wild type and the single tDGC mutants (disrupting individual salt bridge mutants) is visible. The melting temperature Tm, was determined by a Boltzmann sigmoid analysis (see text).

