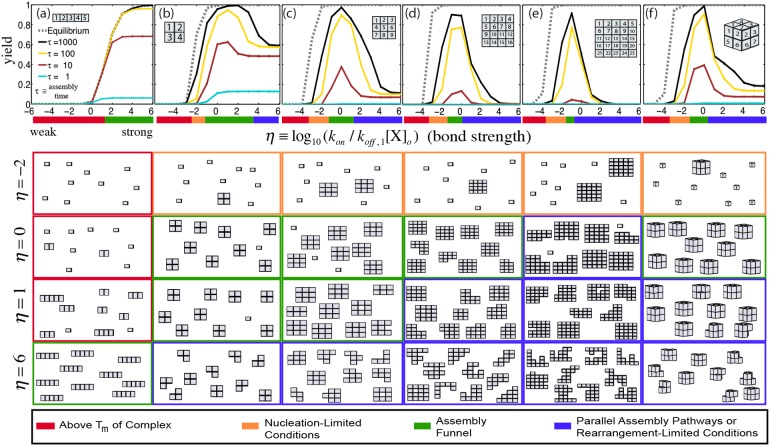
Figure 2. Thermodynamic equilibrium is a good predictor of yield for isothermal assembly after long assembly times for 1-dimensional complexes, but not 2- or 3-dimensional complexes.
Assembly yields for a (a) 1×5 line complex, (b) 2×2, (c) 3×3, (d) 4×4 and (e) 5×5 square grid complex and (f) 2×2x2 cube complex as a function of the dimensionless temperature parameter,  . Inset diagram depicts the complex. Numbers on the components in the complex indicate component identity (e.g. component “1” is different than component “2”). The dashed line indicates thermodynamic equilibrium. Dimensionless reaction time is defined as
  where
where  is the macroscopic forward reaction rate constant and
  is the initial concentration of components. Colored bars and boxes below figures represent the four different assembly regimes (Text S3). The assembly funnel regime is considered to be where the complex is thermodynamically favored (i.e.,
 ) and assembly is rapid such that
  . Assembly “snapshots” (below graphs) are taken at
  and
and  (top row),
  ,
,  , and
, and  (bottom row) and comprised of ten random species drawn from the reaction mixture, weighted by concentration (Text S4). Error bars indicate the standard deviation of the reported quantity after 10 simulations and where omitted, are <1%. Here and elsewhere unless otherwise noted, there is no bond coupling (
 ).
).

