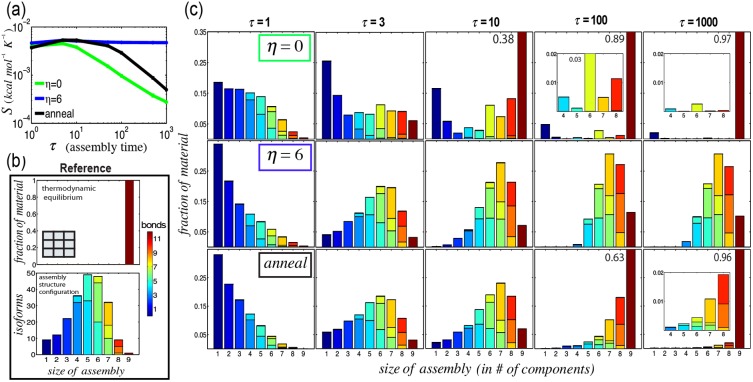
Figure 3. An assembly funnel means that complex assembly occurs via a small number of pathways.
The possible set of reaction pathways govern assembly outcome under rearrangement-limited conditions, whereas thermodynamically favorable pathways govern assembly outcome in the assembly funnel regime. (a) Conformational entropy ( ) of the system under different assembly conditions as a function of assembly time,
  . (b) Reference energy distributions of a 3×3 square grid complex based on thermodynamics and assembly configuration. Color spectrum indicates the number of bonds in an assembly. (c) Partition of energies at different times during self-assembly in the assembly funnel regime at
  (green box), rearrangement-limited conditions at
  (blue box), and during an anneal (black box). Over the course of an anneal,
  transitions from -6 to 6, spending
  at 100 different linearly decreasing isothermal conditions. Values at the top right are complex yields. Inset plots show detail. Error bars <1%.

