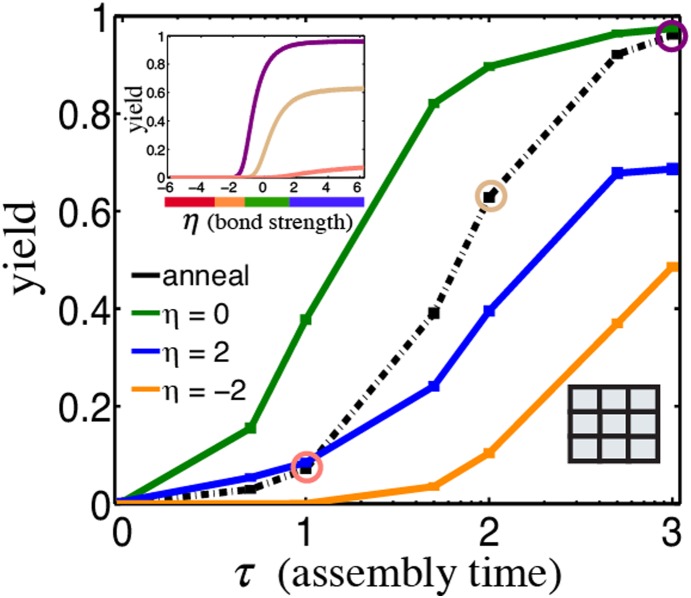
Figure 4. Complexes form rapidly in the assembly funnel regime.
Yield of 3×3 square grid complex as a function of reaction time by assembling via annealing and at various isothermal assembly conditions:  (orange, nucleation-limited),
  (green, assembly funnel)
  (blue, parallel assembly pathways and rearrangement-limited). Inset plot (top left) depicts yield during an anneal as a function of interaction strength for different reaction times:
  (salmon),
  (beige), and
  (purple). Inset diagram (bottom right) depicts the complex.

