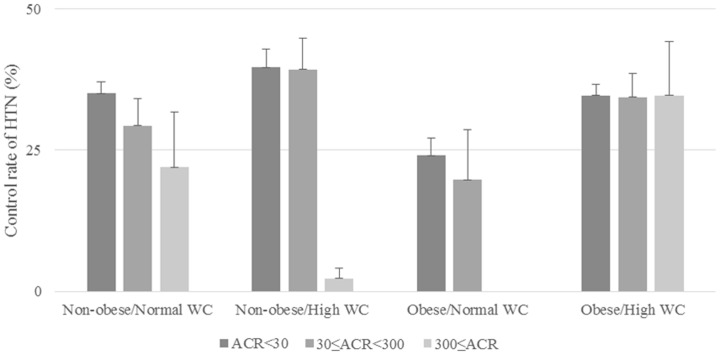
Figure 2. HTN control in subjects with and without obesity and abdominal obesity by tertile of ACR.
P value for trend was <0.001 for the non-obese/high WC group only. P values were <0.05 between two groups; ACR <30 vs. 30≤ ACR <300, and ACR <30 vs. ACR ≥300 for the non-obese/normal WC group only. The p values and p values for trends were not statistically significant in the other three groups. HTN, hypertension; ACR, albumin–creatinine ratio; WC, waist circumference.

