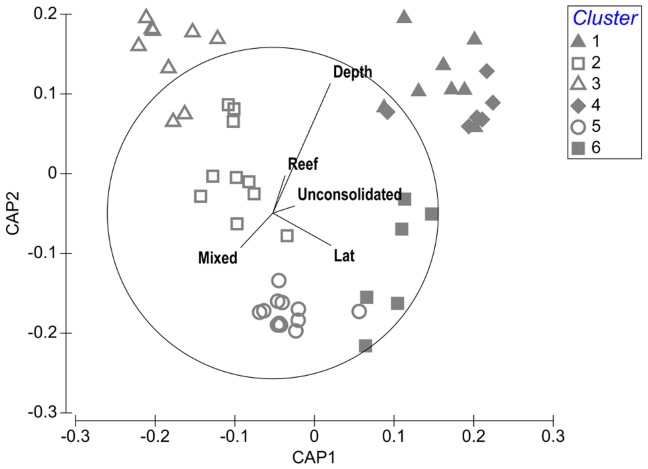
Figure 4. Canonical Analysis of Principle coordinates (CAP) plot discriminating sites based on fuzzy clustering.
Each site was assigned to the cluster for which it had the highest probability of membership. Sites are shown as symbols: filled grey symbols represent sand-associated assemblages and open symbols represent reef-associated assemblages. Vectors of all environmental variables are overlaid and are proportional to their correlation with either CAP axis one or two.

