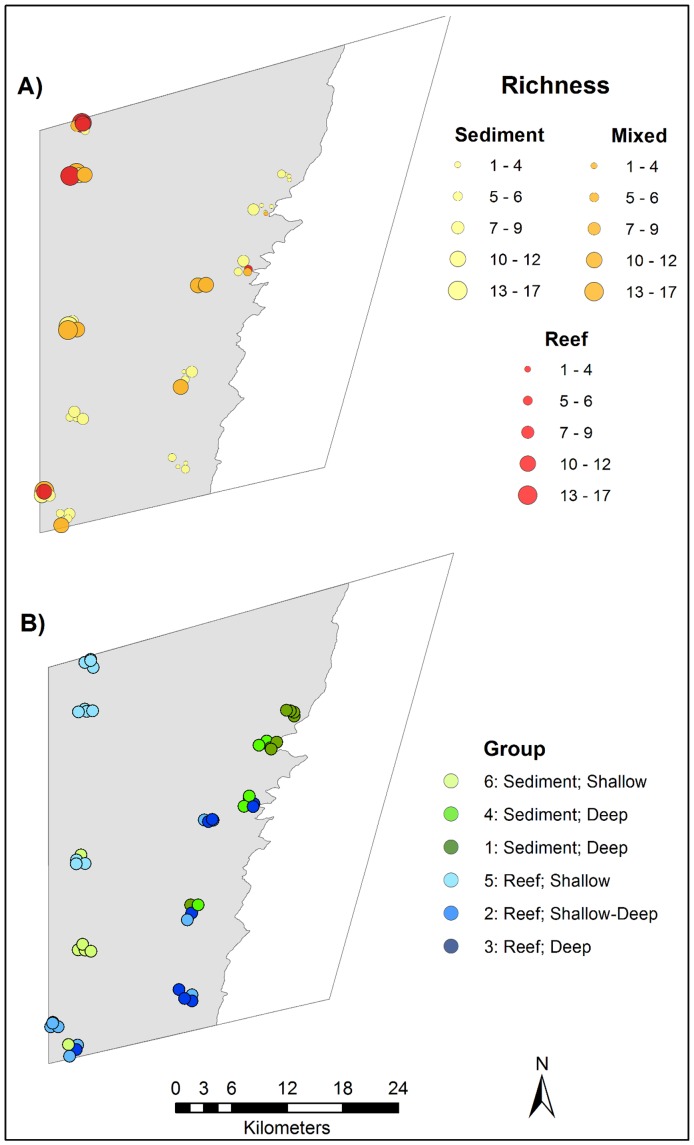
Figure 5. Spatial distribution of A) species richness B) fish assemblage groups on the Flinders CMR shelf (shaded grey).
Increasing size of symbols in A) indicate increasing species richness. Symbols are colour coded according to the observed substratum type in BRUV footage: yellow = sediment; orange = mixed; red = reef. Assemblages in B) are coded by colour, with predominantly sediment-associated assemblages coloured green and predominantly reef-associated assemblages coloured blue.

