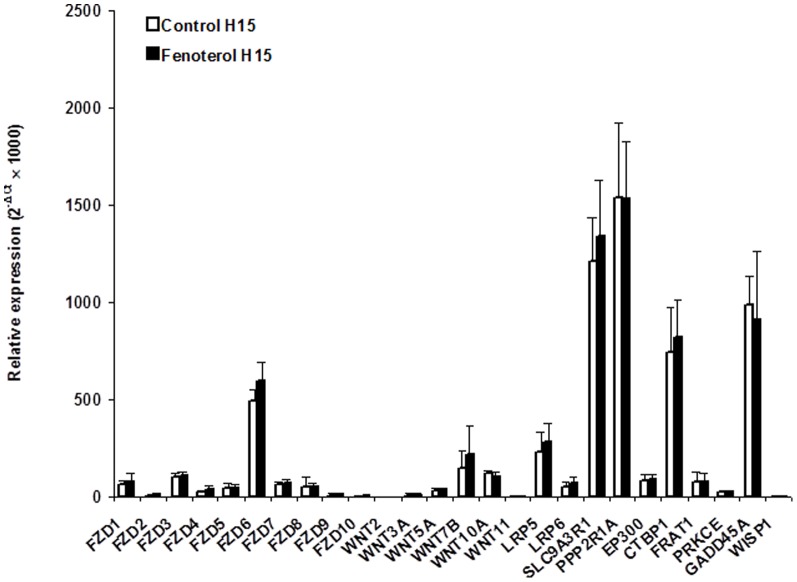
Figure 4. Gene-expression in primary cultures of human airway epithelial cells incubated with or without (paired controls) 0.1 µM fenoterol for 15 hours.
Data are expressed as relative expression (where ΔCt is the difference between the target gene Ct and the mean Ct of the reference genes). Values are means ± SEM (n = 6). No difference between fenoterol and paired controls were statistically significant.

