Fig. 1.
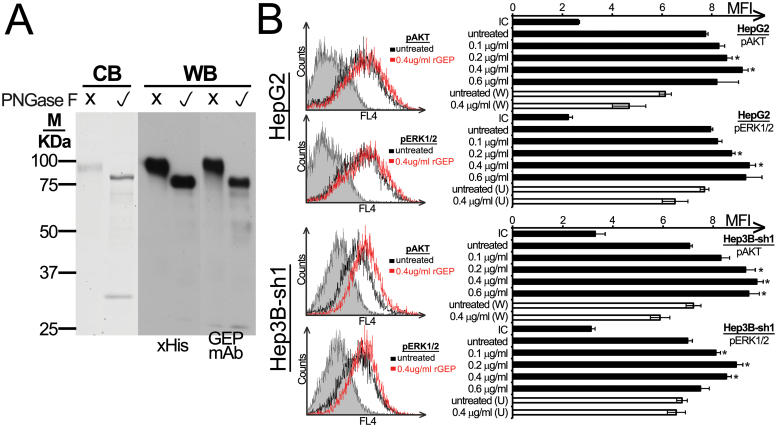
Purity and signaling transduction of rGEP. (A) Purified rGEP was either untreated or deglycosylated by PNGase F and was analyzed in SDS–PAGE. Left panel shows the visualization of Coomassie blue staining (CB), where PNGase F was found at ~30kDa. The middle and right panels show the western blot (WB) analysis after detection of anti-His antibody and GEP mAb, respectively. One microgram of rGEP was used for each lane in Coomassie blue staining, whereas 10ng was used for western blot. (B) HepG2 and the GEP-suppressed Hep3B-sh1 were FBS-starved for 48h and were incubated with rGEP for 5min, followed by trypsin-EDTA detachment, formaldehyde fixation and 70% methanol permeabilization. Specific antibodies against pAKT and pERK1/2 were used for detection. If inhibitors were involved, 100nM wortmannin (W) or 10 µM U0126 (U) was added to the cells 1h in prior to the assay and was withdrawn before rGEP incubation. Representative histograms with isotypic controls (filled area), untreated samples (black line) and cells treated with 0.4 µg/ml rGEP (red line) are shown. The geometric mean fluorescent intensity (MFI) of each sample is shown in the graph. In parallel with rGEP, EGF was used as a positive control for the activation of signaling pathways (data not shown). Asterisks represent significant differences from the control without adding rGEP at 95% level according to Student’s t-test.

