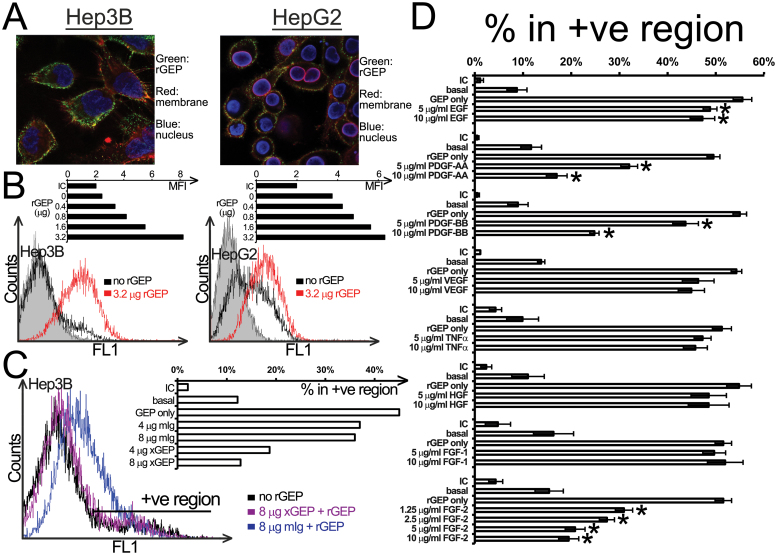
Fig. 2.
Binding properties of rGEP on liver cancer cell lines. (A) Confocal images of rGEP binding on HCC cell surface. Hep3B and HepG2 were incubated with rGEP, specific GEP antibody, anti-rabbit second antibody and Texas Red-conjugated WGA. The cells were then fixed, permeabilized and stained with 4′,6-diamidino-2-phenylindole. (B) Cell surface-binding capacity of Hep3B (left panel) and HepG2 (right panel) for rGEP. Detached cells were incubated with different amounts (0.4–3.2 µg) of rGEP at 4°C and the cell surface binding of rGEP was detected by FITC-anti-His antibody. The histograms show fluorescent intensity of cells and the shaded peaks are isotypic controls. The bar charts show the geometric mean fluorescent intensity (MFI) of different samples. (C) Neutralization of rGEP binding by GEP mAb (×GEP). GEP mAb or mouse IgG were premixed with 0.8 µg rGEP. This rGEP-antibody mixture was added to EDTA-detached Hep3B for binding. The histogram shows the fluorescent intensity of cells bound with pretreated rGEP. The bar chart shows the percentage of cells in the positive region in different samples. Untreated cells detected by isotypic control antibody (IC) and anti-His antibody (basal) are also shown. (D) Competitive binding assay of rGEP. Different growth factors were preincubated with detached Hep3B at 4°C, followed by the binding of 0.8 µg rGEP, detection of anti-His antibody and quantification in flow cytometry. The bar chart shows the percentage of cells in the positive region where the IC and the anti-His basal levels are also shown. The percentages shown are the means and standard deviations obtained from three independent assays. Asterisks represent significant differences from the ‘rGEP only’ at 95% level according to Student’s t-test.

