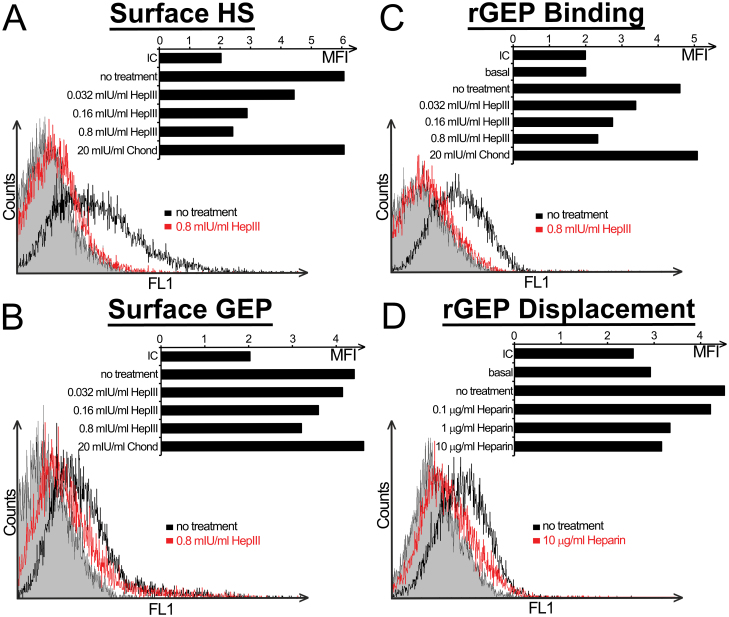
Fig. 3.
GEP interacts with HS on cell surface of liver cancer cell line. (A–C) Hep3B cells were incubated with the indicated enzymes in lyase buffer at 37°C for an hour. Cells were detached by EDTA and collected for antibody detection and rGEP binding. The bar charts show the geometric mean fluorescent intensity (MFI) of each sample, whereas ‘basal’ represents untreated cells detected by anti-His without the addition of rGEP. Because the basal MFI between treated cells and untreated cells are similar, only that of the untreated cells is shown. The histograms show the peaks of untreated cells and cells treated with 0.8 mIU/ml HepIII, whereas shaded peak represents isotypic control (IC). (A) Cell surface HS of the detached cells was detected by HS mAb. (B) The treated cells were detected by FITC-conjugated GEP mAb to assess the change of cell surface expression of GEP. (C) The detached cells were incubated with 0.8 µg rGEP at 4°C to determine their rGEP binding capacity. The bound rGEP was then detected by anti-His antibody. (D) Hep3B cells were detached and incubated with 0.8 µg rGEP at 4°C. The cells were then incubated with the indicated amounts of heparin on ice for 15min and then washed with blocking buffer for twice while the residual bound rGEP was detected by anti-His antibody. In the histogram, only the IC, untreated cells and the sample washed by 10 µg/ml heparin are shown. Chond: chondroitinase ABC; HepIII: heparinase III; IU: international unit.

