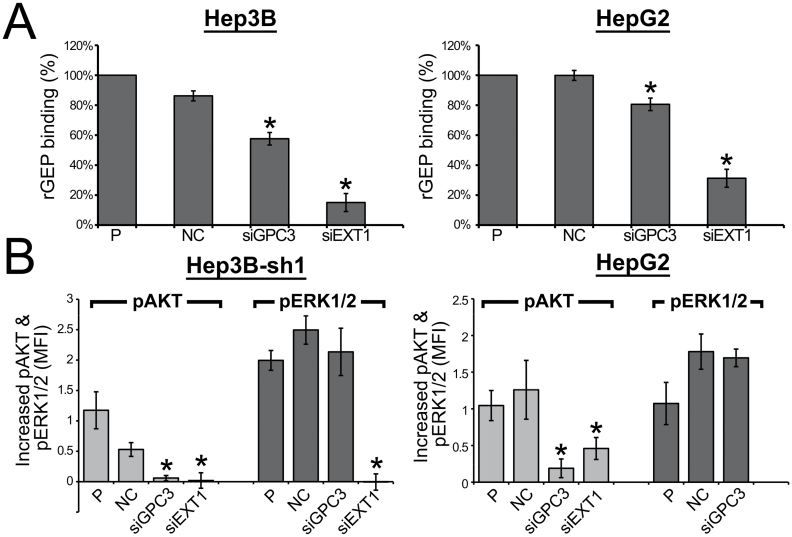
Fig. 6.
rGEP binding and rGEP-mediated signaling transduction in HCC cells after suppression of GPC3 and EXT1. Cells were transfected with NC siRNA and siRNAs targeting GPC3 and EXT1 (HSS104149 and HSS103435, respectively, from Life Technologies). (A) The cells were detached at 48h posttransfection for rGEP binding assay. The detached cells were incubated with 3.2 µg rGEP, followed by detection of anti-His antibody and analysis in flow cytometry. The chart shows the relative percentage of binding by comparing the MFI of each transfectant to the untreated cells (P). The means and the standard deviations were obtained from three independent assays. Asterisks represent significant differences from the ‘NC’ at 95% level according to Student’s t-test. The binding properties of Hep3B and Hep3B-sh1 are the same. (B) Suppression of GPC3 and EXT1 in HCC cell reduced the rGEP-mediated signaling transduction. Two cell lines (HepG2 and GEP-suppressed Hep3B) were transfected with the siRNAs and were treated with or without 0.2 µg/ml rGEP for 5min. Cells were detached, fixed by formaldehyde, permeabilized by 70% methanol and stained with fluorescein-conjugated specific antibody against pAKT and pERK1/2. The graphs show the difference of MFI with and without rGEP induction, reflecting the increased amount of pAKT and pERK1/2 upon rGEP induction in different siRNA treated cells. Asterisks represent significant differences from the ‘NC’ at 95% level according to Student’s t-test.

