Fig. 5.
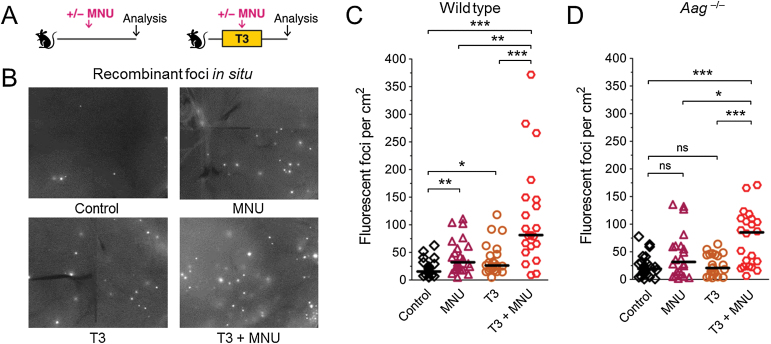
DNA damage, cell proliferation and Aag interact on HR in vivo. (A) Experimental setup. Mice were fed a diet with thyroid hormone (T3) or control diet. At the peak of T3-induced cell proliferation, mice received MNU (25mg/kg i.p.) or control treatment. Sequence rearrangements were measured 3–4 weeks after MNU injection. (B) Induction of HR detected in situ in pancreata of wild type mice. Freshly harvested pancreata were compressed to 0.5mm and imaged under a fluorescent microscope. Representative details of composite images are shown, fluorescent foci are apparent in situ. Original magnification, ×1. Brightness and contrast have been enhanced identically across images. (C) In wild type mice, MNU-induced damage and T3-induced proliferation both induce HR, and interact in a synergistic fashion. Frequencies of fluorescent foci per cm2 pancreatic tissue are shown in control (n = 21), MNU-treated (n = 23), T3-treated (n = 22) and T3+MNU-treated (n = 21) mice. T3+MNU treatment induces the formation of more fluorescent foci than the sum of the effects of MNU and T3. (D) In Aag –/– mice, the increase in HR in MNU-treated mice (n = 22) compared to control mice (n = 23) does not reach statistical significance, and T3-treated mice (n = 22) show no increase. T3+MNU treatment (n = 22) induces the formation of more fluorescent foci than the sum of the effects of MNU and T3. In B and C, symbols indicate data from individual mice, horizontal bars show median values for each group. ns, not statistically significant, *P < 0.05, **P < 0.01, ***P < 0.001 (Mann–Whitney U-test).

