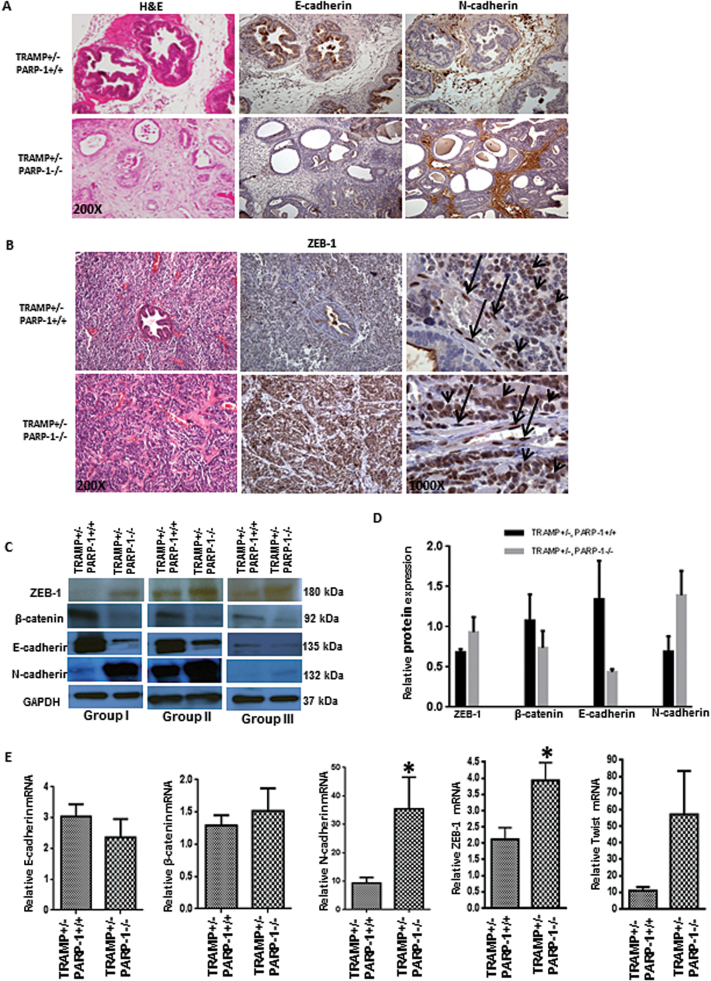
Fig. 4.
PARP-1 deficiency yields acquisition of EMT phenotype during prostate tumorigenesis. (A) Expression profile of E-cadherin and N-cadherin in prostate tissue from TRAMP+/− PARP-1+/+ and TRAMP+/− PARP-1−/− mice (28 weeks); magnification ×200. (B) Reveals immunoreactivity pattern for ZEB1 in prostate tumor sections from TRAMP+/−/PARP-1 +/+ and TRAMP+/−/PARP-1−/− mice. Magnification, ×200 and ×1000 (middle and right panels, respectively, ZEB-1 staining). Serial sections were stained with hematoxylin and eosin (left), revealing high grade, poorly differentiated prostate tumor from TRAMP+/− PARP−/− mice. (C) Shows western blot analysis of EMT regulators ZEB-1, E-cadherin, N-cadherin, β-catenin expression in prostate tissue from three different groups of TRAMP+/− PARP-1+/+ and TRAMP+/− PARP-1−/− mice (16 weeks). The three blots are representative of three independent groups of mice (groups I, II and III). (D) The barographs indicate the relative band intensity (from C) as determined by densitometry and expressed relative to glyceraldehyde 3-phosphate dehydrogenase (loading control). (E) Shows mRNA profile by reverse transcription–PCR analysis of E-cadherin, β-catenin, N-cadherin, ZEB-1 and Twist gene expression in TRAMP+/− PARP-1+/+ versus TRAMP+/− PARP-1−/− mice (16 weeks). Statistical significance (*) was determined at a value of P < 0.05. Error bars represent standard error of the mean from the three groups of littermate pairs.

