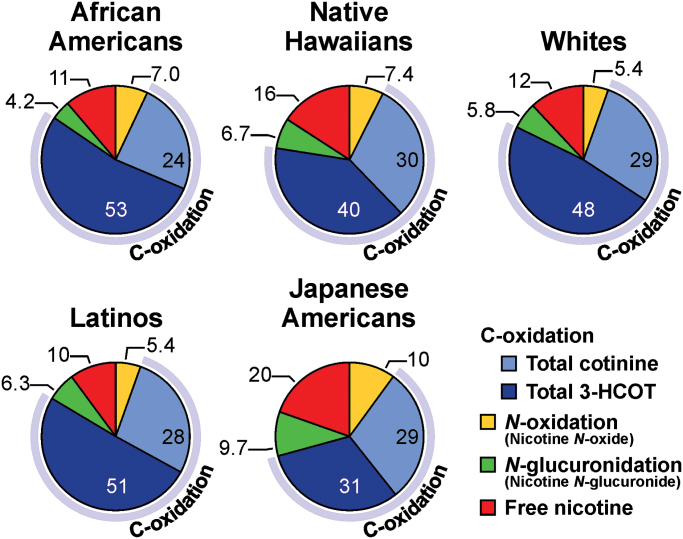
Fig. 2.
Proportion of nicotine metabolized by C-oxidation, N-glucuronidation and N-oxidation in five ethnic/racial groups (values are the molar percent of nicotine and six metabolites excreted in urine). The values for each slice of the pie are the mean percentage of the compound relative to TNE. See Table I for the median (25th−75th) concentrations of total nicotine, total cotinine, total 3-HCOT, nicotine N-oxide and TNE, the proportion of nicotine excreted as a glucuronide and the proportion of TNE excreted as products of C-oxidation.

