
Figure 6. Electrophysiological examination to evaluate the propensity for VA.
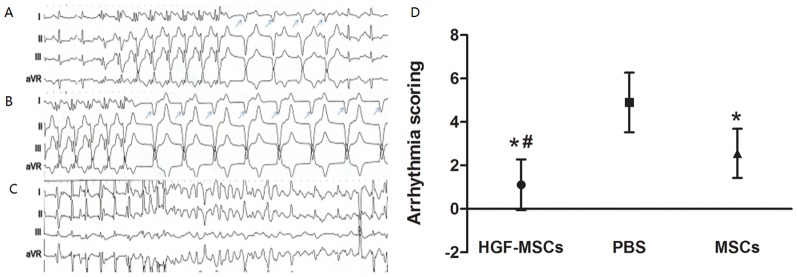
(A) Induced non-sustained ventricular arrhythmia. (B) Induced sustained ventricular arrhythmia. (C) Ventricular fibrillation evoked by additional stimuli. (D) The susceptibility to developing VA, as indicated by the obtained arrhythmia scores, was lower in the HGF-MSC-treated hearts than in the PBS- and MSC-treated hearts. *, P<0.05 vs. the PBS group; #, P<0.05 vs. the MSC group.