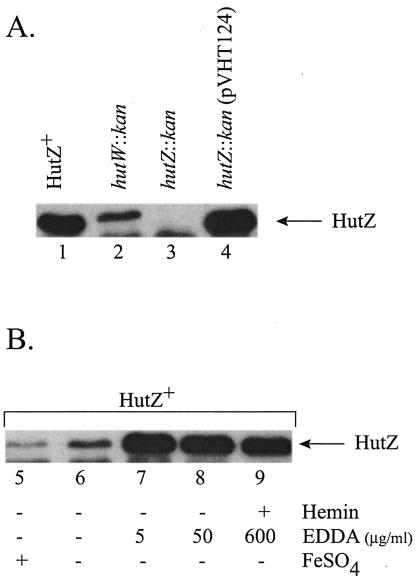
FIG. 6.
Visualization of HutZ and iron regulation of HutZ production. Extracts of total cellular protein were prepared as described in Methods and Materials, separated on an SDS-15% polyacrylamide gel, and visualized with antiserum to HutZ. (A) The following strains were grown in L broth containing 25 μg of EDDA per ml: EWV104 (vibB::cam) (lane 1), EWV107 (vibB::cam hutW::kan) (lane 2), EWV115 (vibB::cam hutZ::kan) (lane 3), and EWV115/pVHT124 (lane 4). (B) EWV104 (vibB::cam) was grown in LB medium containing the following supplement(s): 40 μM FeSO4 (lane 5), no supplement (lane 6), 5 μg of EDDA per ml (lane 7), 50 μg of EDDA per ml (lane 8), or 600 μg of EDDA per ml and 5 μM hemin (lane 9).

