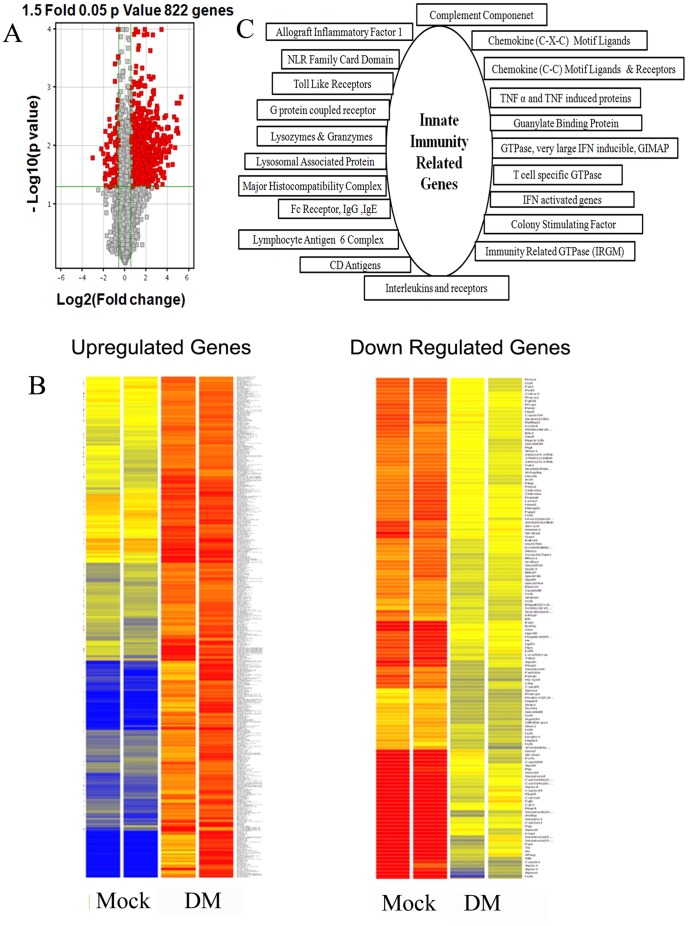
Figure 1. Volcano Plot of differentially expressed transcripts of two RSA59- (DM) infected mouse spinal cords at day 6 post-infection compared to two control mock-infected mouse (Mock) spinal cords (A).
X-axis represents the log2 values of the fold change observed for each mRNA transcript while the Y-axis represents the log 10 values of the p-values of the significance tests between replicates for each transcript. Genes that are up- or down-regulated more than 1.5-fold in RSA59-infected mice compared to control mice are displayed in red. Heat Map of differentially up-regulated and down-regulated genes (B). Heat map of the 822 genes shown in red in A, shows 681 genes are up-regulated while only 141 genes are down-regulated in RSA59 infection (DM) in mice compared to mock-infected controls. The color code/dendrogram shows the expression level increasing from blue in control and gradually moving towards red in infected mice in cases of up-regulated genes, and vice versa in down-regulated genes (blue in infected mice and gradual shift to red in control mice). Functional cluster of genes involved in innate immune responses that were differentially expressed by more than 1.5-fold in RSA59-infected spinal cords compared to mock-infected spinal cords (C). Upregulated genes belong to several gene families known to be involved in apoptosis, microglial activation, complement signaling, soluble factors like cytokines and chemokines, colony stimulating factors, IFN-induced and activated genes, immunity related GTPases, guanylate binding proteins and major histocompatibility complex activation. Detailed differential expression levels (fold changes) of individual genes in each functional cluster are available in Table S1.

