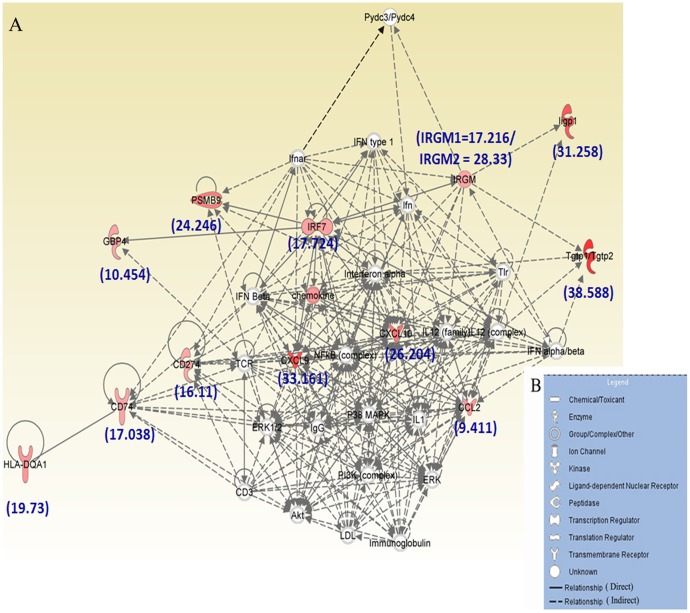
Figure 3. Ingenuity Pathway Analysis (IPA) of the 16 genes most highly up-regulated in microarray analysis.
A, Functional network showing the direct and indirect relationships that exist between these molecules which lead to development of immunological diseases. The figure legend (B) shows the different symbols that have been used in the functional network (A).

