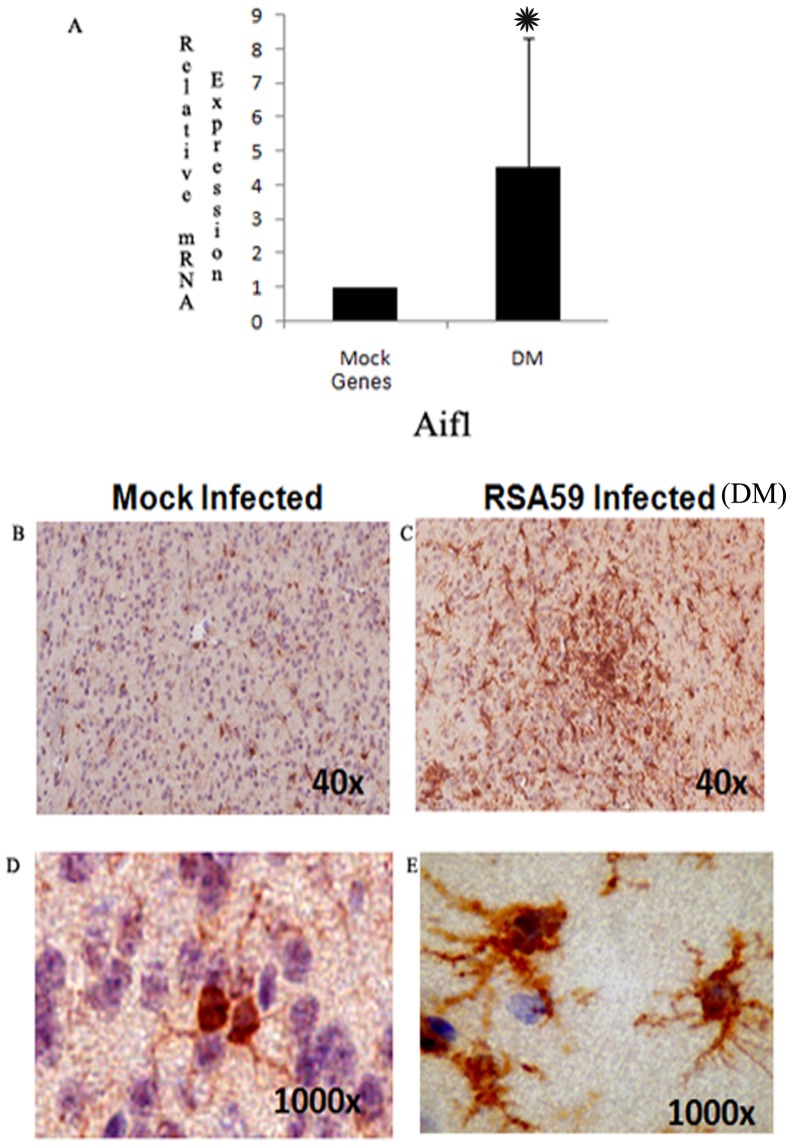
Figure 5. Relative Iba1 (Aif1) mRNA expression and protein expression in RSA59 (DM strain) infected mice compared to mock infected control.
Real Time PCR analysis of the Aif1 gene expression showed that there is approximately four fold up regulation in RSA59 infected mice brain compared to mock infection (*Represents significant upregulation. P value of Aif1 <0.005) (A). Immunohistochemistry with anti Iba1 antibody showed a huge upregulation of microglia specific Iba1 protein expression in RSA59 infected brain section (C) compared to mock infected control (B). Higher magnification (1000x) of individual microglia in RSA59 infection showed the presence of large cell body and amoeboid processes (phagocytic in nature) (E). In resting control brain microglia has thin ramified processes and cell size in comparatively smaller. (D).

