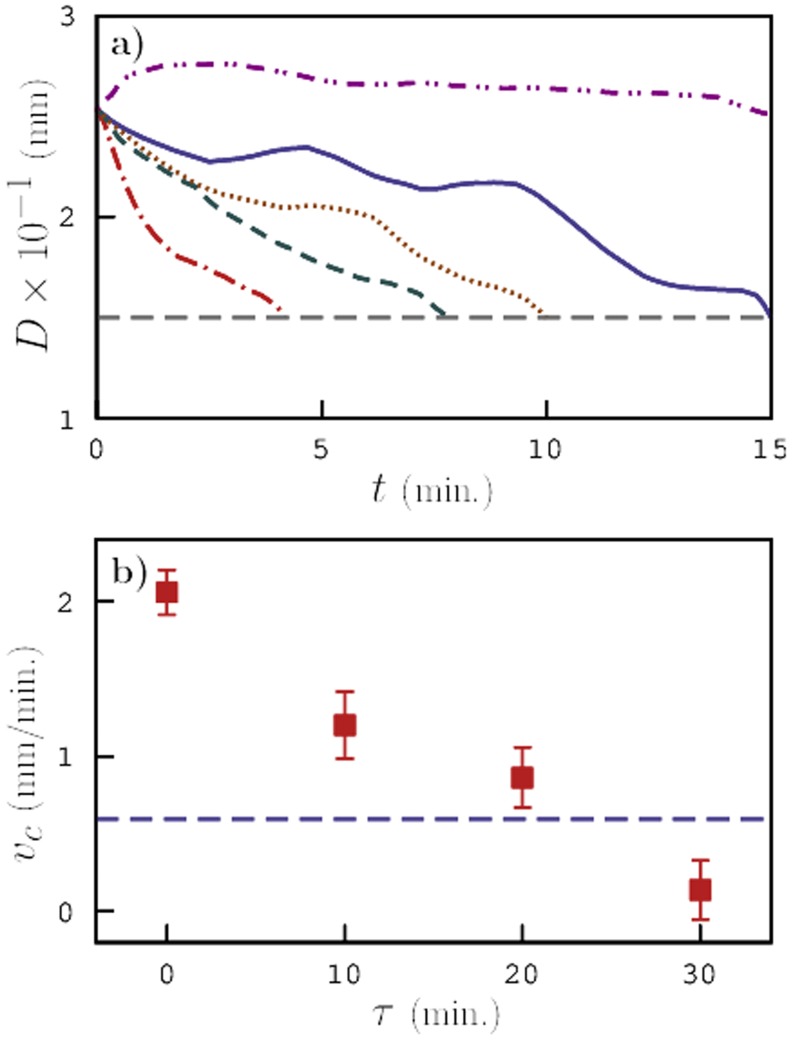
Figure 8. Chemotaxis velocity.
a) Average distance between C. elegans and chemoattractant concentration peak as a function of time during the chemotaxis experiment for control worms (solid) and pre-exposed animals after 0 (dash-dot), 10 (dashed), 20 (dotted), and 30 (dash-dot-dot) minutes and b) speed with which C. elegans approach the concentration peak obtained from slopes of curves in a).

