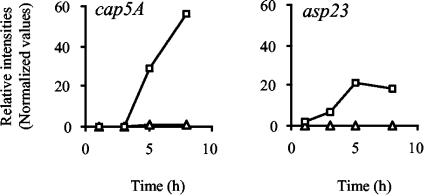
FIG. 5.
Transcription profiles of capA and asp23. Transcript levels for Newman (□) and IK184 (▵) cells sampled at different time points of growth (x axes). Data points were plotted as relative intensity values (y axes). The influence of σB on the expression of capA, encoding capsular polysaccharide synthesis enzyme A, and asp23, encoding alkaline shock protein 23, is shown.

