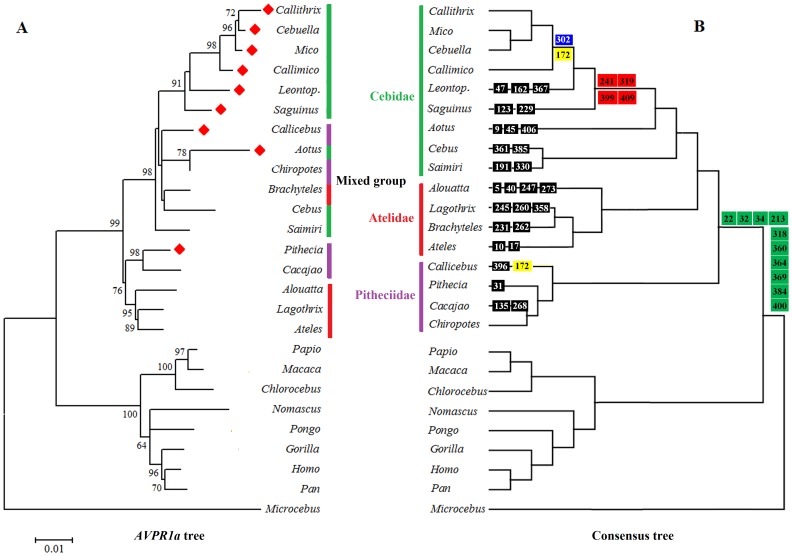
Figure 3. Molecular phylogenetic trees in primates.
A. Tree inferred from AVPR1a nucleotide coding sequences in primates. If bootstrap support is <60, no value is shown at nodes. Scale bar indicates the branch length in nucleotide substitutions per site. A red diamond indicates a genus characterized by social monogamy. B. A consensus tree of primates based on 54 nuclear genes (34,927 bp; [30]). Families Cebidae, Atelidae and Pitheciidae are highlighted in green, red and purple lines, respectively. Amino acid substitutions of the AVPR1a gene are plotted on the consensus tree: NWM-specific (green square), Callitrichinae-specific (red square), marmoset-specific (blue square), marmoset and Callicebus-specific (yellow square), and genera-specific (black square).

