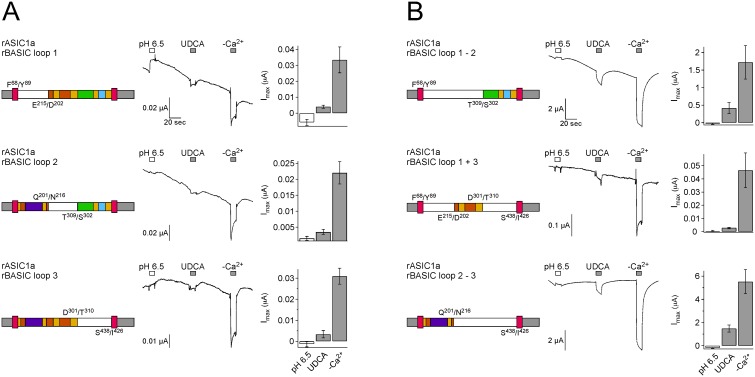
Figure 9. Several regions of the ECD of rBASIC are involved in bile acid sensitivity.
A, B) Left panel, schematic drawings of chimeras; rASIC1a portions are depicted as in Fig. 5A, rBASIC portions are depicted in white. Residues defining the borders of the ASIC1a and BASIC sequences are shown. Middle panel, representative traces of currents induced by the subsequent application of pH 6.5 and 2 mM UDCA followed by the removal of divalent cations (–Ca2+). Right panel, quantitative comparison of current amplitudes induced by pH 6.5, UDCA and divalents removal. Error bars represent SEM; n = 6–12.

