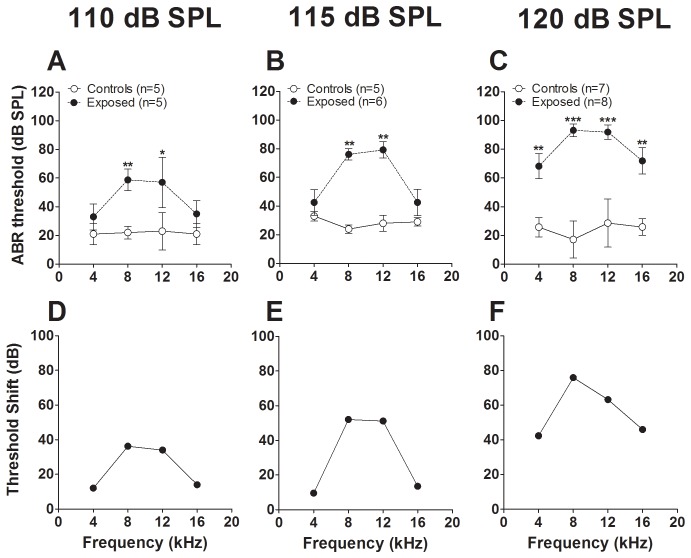
Figure 2. Effect of increasing the level of exposure on ABR thresholds.
The exposure sound was a continuous 10 kHz tone presented for 4 hours at a level of 110 dB SPL (A), 115 dB SPL (B) or 120 dB SPL (C). Each point represents the mean (±S.E.M.) of ABR thresholds measured in 5–8 animals, upon completion of the ASR testing period. Results from A, B and C are represented as threshold shifts in D, E and F, respectively. *: p<0.05, **: p<0.01, ***: p<0.001.

