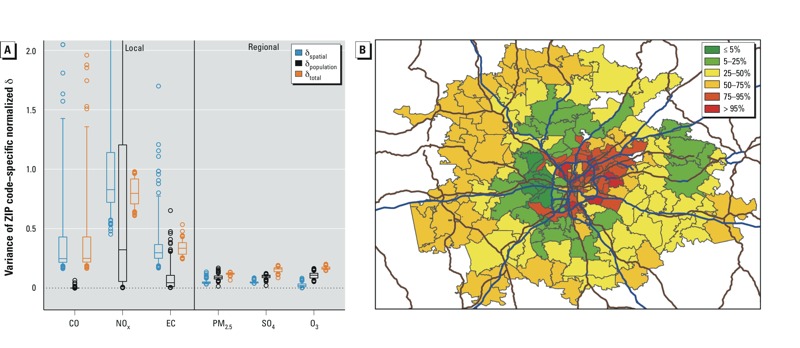
Figure 3.

Variance of exposure error. (A) Variance of normalized exposure error (δ) for local and regional pollutants (see Supplemental Material, Figure S4, for full extent of data and outliers). The bottoms and tops of boxes represent 25th and 75th percentiles, lines within boxes indicate the median, and the whiskers represent 5th and 95th percentiles; n = 193. δspatial = AQ – CS; δpopulation = PE – AQ; and δtotal = PE – CS. (B) Map showing variance of δspatial of NOx for ZIP codes in the Atlanta metropolitan area. Blue and brown lines indicate major roads; colors represent percentiles, where 5% = 0.58; 25% = 0.72; 50% = 0.83; 75% = 1.14; and 95% = 4.14.
